The Figures 4a and 4b show present number redshift diagrams using 48,690 quasars.
For making of this Hubble diagram the QSO catalog from M.-P. Véron-Cetty (August 2003) was used in which approx. 48,690 quasars are listed with red shift and apparent brightness.
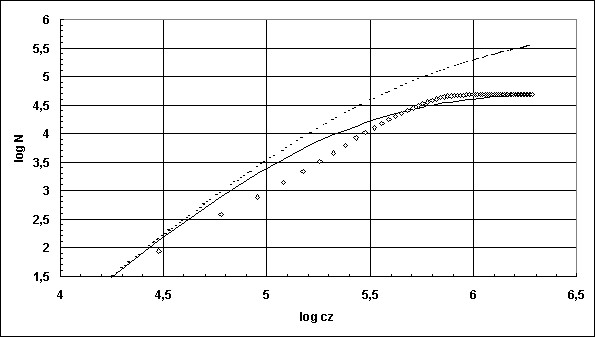 |
Fig. 4a: number redshift diagram
This Figure shows the comparison of the theory with the quasar catalog of M.-P. Véron-Cetty and others (August 2003).
The diamonds show the measurements.
The lower bent line corresponds to the theory introduced here.
The dotted line corresponds to the theoretical derivation which can be found in the literature.
For the fitting of this curve to the curve being part of the new theory results NA = 1,39*106 for the whole sphere.
For the new theory NA = 5,70*104 is found.
zurück |
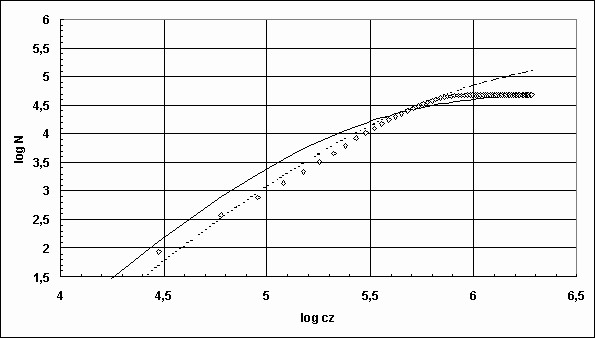 |
Fig. 4b: number redshift diagram
This Figure shows the same diagram as Figure 4a.
But here the theory from the general literature was adapted directly to the measurements.
Through this arises NA = 5,00*105 for the whole sphere.
The expectation for the total number of the traceable quasars still appears as fundamentally to big here, too.
In addition, this theory cannot explain the enormously lack of quasars for great red shifts.
It also must be suspected at this way of the fitting to the measurements that quasars are not only objects from the early days of the universe rather they exist until the presence.
zurück |
Copyright by Steffen Haase, Leipzig (2003)
last update: 11/05/2003
last correction of spelling mistakes: 05/15/2005 |